
Keno Hot Number Lists Against the 20-of-80 Draw Math
Hot keno numbers are a frequency count, not a forecast. See how big a gap pure chance leaves over 100 draws, and why the next draw stays 1 in 4.
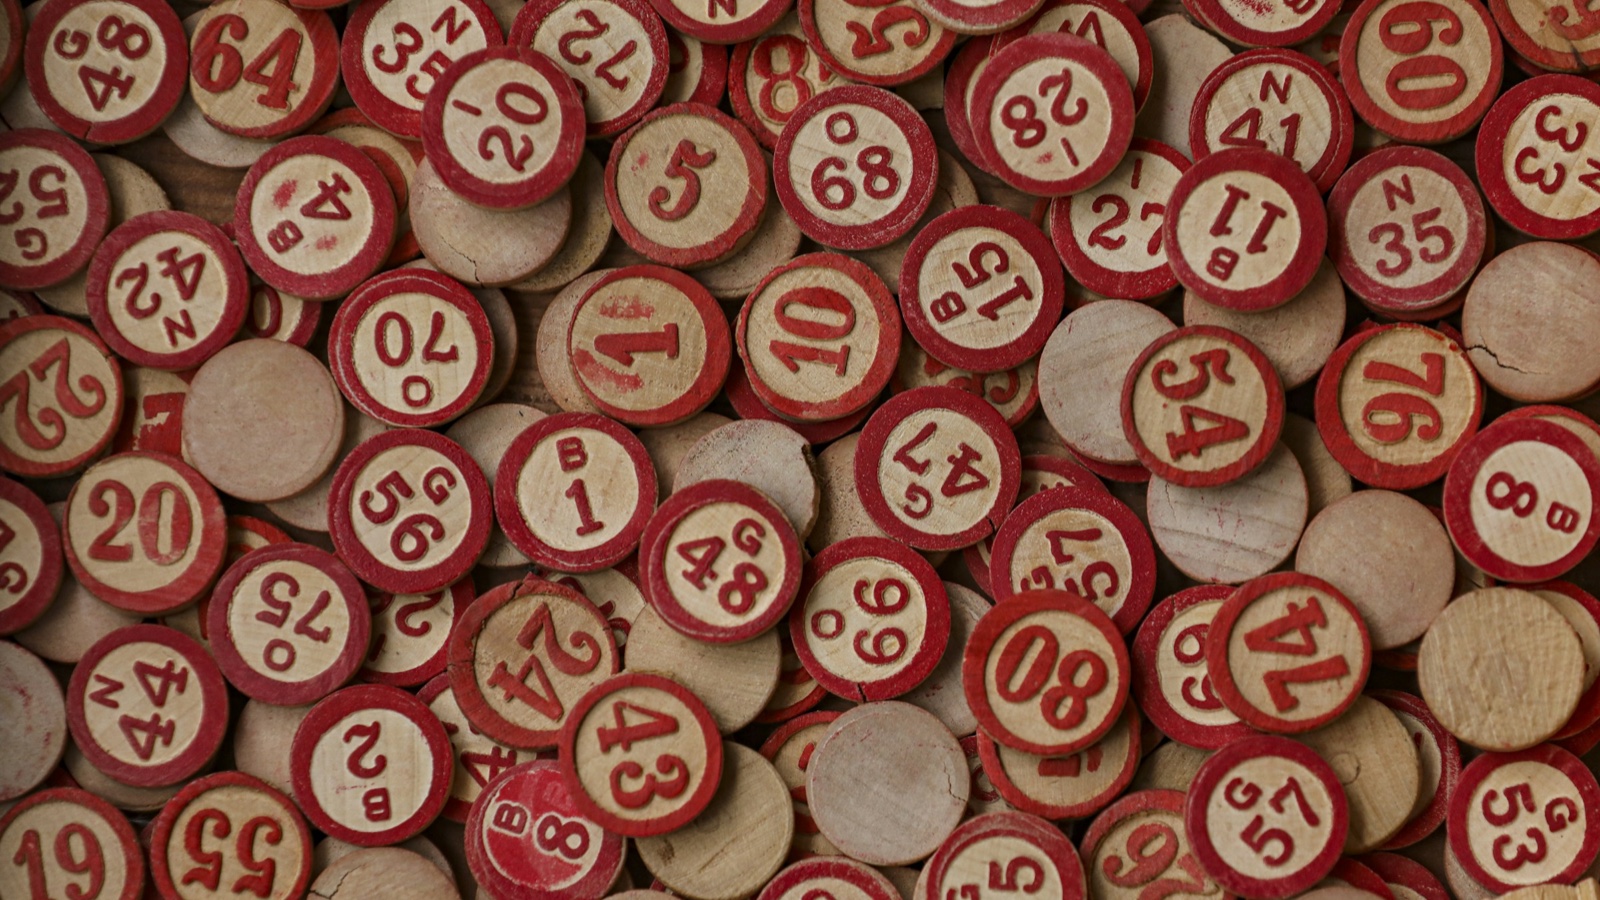
A keno hot number is a number that has turned up more often than the rest in a recent run of results, and that is all it is. It describes the past, not the next draw: each keno game randomly selects 20 winning numbers from 1 to 80, so every number carries the same 1 in 4 chance in every draw, however hot or cold its record looks.
What makes hot lists persuasive is that the gaps between numbers look far too big to be luck. They aren't. Below we work out how much spread a perfectly fair draw produces on its own, then look at the things that genuinely change what you can win.
What hot and cold keno numbers actually measure
Hot numbers in keno are a frequency count over a results window, and cold numbers are the ones with the fewest hits in that same window. Neither label says anything about the machine; it only says how chance happened to fall lately.
Results pages and apps tally how often each of the 80 numbers appeared across a recent stretch of draws, then rank them. Players split into two camps from there. One backs the hot keno numbers because they seem to be "running". The other backs the cold ones because they seem "due". Both stories quietly assume the draw remembers what it did before.
It doesn't. In Massachusetts, the random number generator has no idea which numbers are played in any drawing, according to a 2023 WGBH report. A number cannot be due, and it cannot be on a streak, when the system choosing it keeps no ledger of either.
How much spread does pure chance produce?
A lot more than most people expect. Over 100 fair draws the average number appears 25 times, yet the hottest of the 80 typically lands around 36 hits and the coldest around 15, a better than two-to-one gap with no cause behind it at all.
Here is the plain-English maths. Each draw takes 20 of the 80 numbers, so any single number has a 1 in 4 (25%) chance of being picked in a given draw. Across 100 draws that averages out to 25 appearances, but individual numbers wobble around that average by roughly 4.3 hits either way (the standard deviation of a 1 in 4 event repeated 100 times). With 80 numbers all wobbling at once, a few are bound to drift well above the pack and a few well below it. Those outliers are exactly what a hot and cold chart puts at the top and bottom.
Connecticut runs draws every 4 minutes from 5:04 AM to 1:56 AM, as of October 2026, which works out to about 314 draws in a single day. That gives a second window to compare.
| Results window | Average hits per number | Typical hottest number | Typical coldest number |
|---|---|---|---|
| 100 draws | 25 | about 36 | about 15 |
| One Connecticut day (about 314 draws) | 78.5 | about 97 | about 60 |
The "typical" figures are what fair 20-of-80 draws produce on average for the most and least frequent number in the window. Notice what happens as the window grows: the raw gap in hits gets bigger, but relative to the average it shrinks. That is the law of large numbers doing its quiet work, and it is why a hot list built from a short window looks the most dramatic and means the least.
So if you open a results page and see one number far ahead of another, the honest first reading is "about what chance does", not "something is going on".
Do hot keno numbers change the odds of the next draw?
No. Lotteries certify their draws so that past results cannot shape future ones, which means a number that hit 36 times in the last 100 draws has the same 1 in 4 chance next time as one that hit 15 times.
The rules say so in plain terms. Michigan's lottery requires its random number generator to be certified so that each combination is equally likely and unpredictable. In Massachusetts, the generator is constantly picking sets of 20 numbers, multiple times per second, regardless of what has been wagered, and a lottery official told WGBH that all 20-number combinations are equally likely.
Put those together and the hot list loses its job. Equal likelihood for every combination means no number, and no group of numbers, is favoured by its history. A chart of recent frequencies is a fair record of the past and a coin flip as a guide to the future.
Why prize tables matter more than which numbers you pick
Your choice of numbers can't move the odds, but your choice of state, game and spot count does, because each lottery sets its own prize table on top of the same 20-of-80 draw. That is where the real differences in a keno ticket live.
Connecticut lets you choose from 1 to 10 spots. Its 10-spot game lists overall odds of 1 in 9.1 with a $100,000 top prize at 1 in 8,911,712, as of October 2026. Part of that overall figure comes from small prizes, including $4 for catching none of your 10 numbers, at 1 in 22. Virginia, running the same kind of draw, lists overall odds to win a prize between 1 in 2.8 and 1 in 16.6, depending on how you play. Ohio's $10 OH KENO, an EZPLAY game rather than a live draw, shows overall odds of 1 in 3.53 and a 68.02% payout.
| Game | What the lottery lists (as of October 2026) |
|---|---|
| Connecticut Keno, 10-spot | Overall odds 1 in 9.1; $100,000 top prize at 1 in 8,911,712 |
| Virginia Keno | Overall odds from 1 in 2.8 to 1 in 16.6 |
| Ohio $10 OH KENO (EZPLAY) | Overall odds 1 in 3.53; payout 68.02% |
Two things stand out. "Overall odds" counts every prize, from the top award down to the smallest return, so a game with friendlier overall odds is not necessarily paying more in total. And a stated payout such as Ohio's 68.02% means that, across all tickets, the game returns about 68 cents of every dollar played as prizes over the long run. No hot or cold list touches either number.
Using hot numbers for keno without fooling yourself
Playing a hot list is fine as a way to pick numbers, as long as you treat it as a choice of taste rather than an edge. Your chance is exactly what it would be with birthdays, a quick pick or the numbers nobody has touched in a week.
A few habits keep it in proportion:
- Read a frequency chart as history. Big gaps over a short window are expected from chance, as the table above shows.
- Compare prize tables, not number lists. Spot count and the state's paytable decide what a ticket can return.
- Set your spend before the first draw, and treat any win as a pleasant surprise, never a pattern to chase.
- Be wary of anything sold as a keno system. If combinations are equally likely, no system can rank them.
Your odds questions
Can AI predict Keno?
No. A keno draw comes from a random number generator that lotteries certify as unpredictable, and Michigan writes that requirement into its testing rules. With no pattern in the output, there is nothing for an AI model to learn, so its picks carry the same 1 in 4 chance per number as yours.
What is the best number prediction tool for keno?
There isn't one that beats chance. A frequency chart is a useful record of what already happened, and it can be fun to play from, but it cannot forecast the next 20 numbers. Any tool that claims otherwise is selling a story.
Which AI is best for game prediction in draw games?
For a fair draw game, none. Prediction tools work where past data shapes future results. In keno, the Massachusetts generator keeps producing sets of 20 numbers with no idea which numbers anyone has played, so history carries no signal forward.
What's the most won on Keno?
It depends on the state's prize table and the game you choose. In Connecticut, the 10-spot top prize is $100,000 at odds of 1 in 8,911,712, as of October 2026.
Official sources
- Virginia Lottery, Keno (Virginia Lottery game page), accessed October 2026
- Connecticut Lottery, Keno (Connecticut Lottery game page), accessed October 2026
- Michigan Lottery via BidNet, Michigan Lottery RNG certification solicitation, accessed October 2026
- WGBH, Is Keno in Massachusetts fair, May 10, 2023
- Ohio Lottery, $10 OH KENO, accessed October 2026
More from Lucky-Lotto Draw Desk

Related reads
California Lottery Scratcher Odds by Ticket Price

Sweden's Spelinspektionen: The Regulatory System Explained
Kashiwagi vs Donald Trump: The Freeze-Out That Never Finished
Pick 10 Cold Numbers Reach Only Three Appearances

How Gambling Licenses Work: A Technical Breakdown